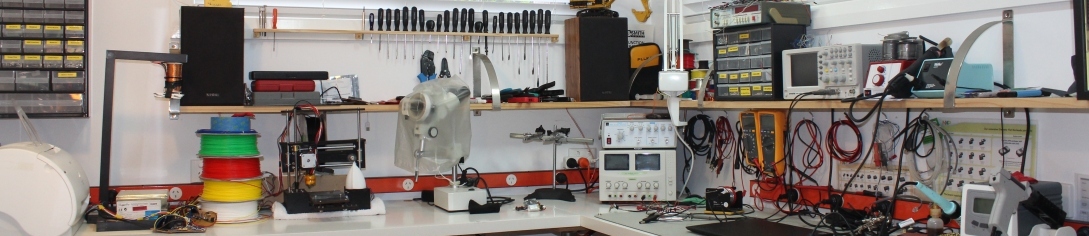
Recently, I have been using MQTT to stream ESP8266 sensor data to a Mosquitto broker running on a Raspberry Pi. I wanted to develop something to show the stream graphically.
I have previously found Dygraphs to be a great piece of software. I like the way it consists purely of client-side javascript, which runs entirely within a web browser. In fact, you can even open an HTML file (containing javascript) from your local disk, without requiring a web server.
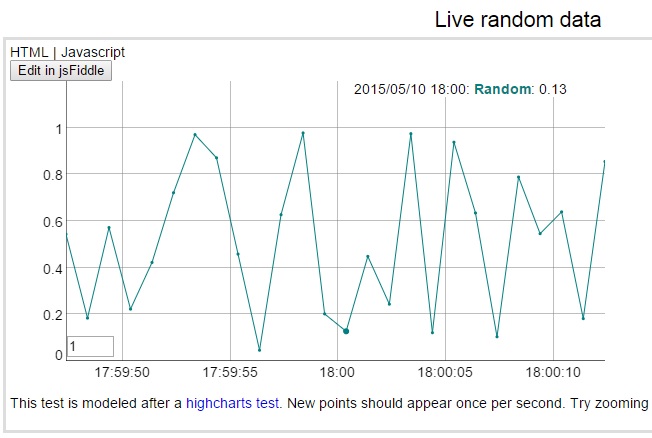 I specifically wanted to build something along the lines of Dygraph’s dynamic update demo, except that I wanted a constant scrolling “window” of values – like a heart monitor for example. (Really, what is the use of having all your data scrunch up against the left of the window?).
Having solved that issue, I then had to connect the graph to my MQTT broker to be able to receive live data to display.
This post goes into details of how I did this, but before going further, here is the result:
[wpvideo uIHfHtPH]
Scrolling Graph
It turned out that to get the Dychart scrolling behaviour that I wanted was remarkably easy. All that was required was to add a single function call.
 If you want to try this out yourself, open the Dygraphs demo in an editing environment by clicking on the “Edit in jsFiddle” button, then then add data.shift() on a new line after the data.push call in the onMessageArrived function:
data.push([x, y]);
data.shift();
Real TIme MQTT Update
To link the graph to the MQTT broker was a bit more challenging. Fortunately I found someone who had done this using HighCharts, which got me most of the way there. (By the way, Highcharts also looks great, but I didn’t want to fall foul of their non-commercial restrictions).
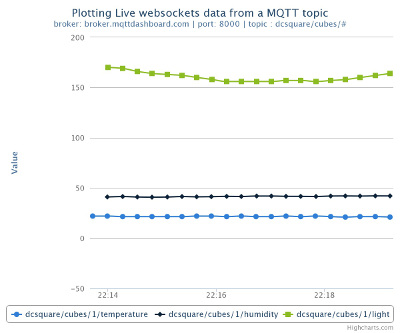 You can find matbor’s mqtt2highcharts software on github. It plots live numbered data on Highcharts from a subscribed mqtt topic using a websocket.
Using the demo as a guide, I modified that software to use Dycharts. You can download my version here.
To try it out, unzip to a local directory. RIght click on Dygraphsmqtt.html and open with a Chrome browser.  The page will connect to a public MQTT broker at iot.eclipse.org and then start graphing the number of active connections. Unfortunately this data only changes every few seconds, so is rather slower than my demo (which updated 5 times per second), but at least illustrates the concept.
To add more series to plot on the graph all that is necessary is to add dimensions to the data[] array. For my example shown in the video, I passed a comma delimited string via MQTT and then used the javascript split function to parse the string as follows:
var parse = thenum.split(",");
data.push([x, parse[1], parse[2], parse[3], parse[4], parse[5]]);
For my setup I needed to connect to my own Mosquitto MQTT broker running on a Raspberry Pi. As mentioned above, the MQTT broker needs to have websocket communication enabled. When you install Mosquitto on the Raspberry Pi, this is not the default.
To correct this, I followed a post on how to Install Mosquitto on Raspberry Pi with websockets enabled, which shows you (step by step) how to compile Mosquitto configured WITH_WEBSOCKETS:=yes.
Note that the websocket port will be different from the MQTT port, so make sure that you specify the websocket port in the web page when configuring the parameters to be used by the javascript.
That’s all there is to it!
You may want to checkout http://www.thingstud.io. It has a complete solution for realtime interfaces for MQTT data, including, in the latest release, a nice realtime graphing widget.
Thanks, and love your work! I’ll definitely give that a try.
Dear friend, your post was a great help to me.
I want to ask you a question, my ESP8266 sensor that this connecting in a DHT22 is publishing in my Mosquitto as a JSON key:
{“d”: {“Temperature”:29.4,”Humidity”:14.7}}
Will I be able to generate a dynamic graphic using $ .getJSON?
Can you help me?
Cezar Sacomani – [email protected]