I am intrigued by the notion put forward by David Rose (seen here presenting at TEDx) of “putting magic in the mundane – that is, having ordinary items that can do extraordinary things”.
I find compelling the notion that for everyday activities there will be a swing in popularity away from having to interact with complex abstract worlds behind glass screens toward a more “authentic” physical experience, for which we humans are so well adapted. But this shift will only be made possible by means of even more advanced technology – able to hide its own complexity.
This month the popular “Thomas the Tank Engine” toy celebrates its 70 anniversary. As a fun project, what could be more appropriate than to bring this traditional toy into the age of IoT, while preserving its physical appearance and simple charm?
For a short overview / teaser, watch the following video (be sure to select HD):
[youtube=https://youtu.be/-o6LYynn95E?hd=1&rel=0]
Inevitably there will be those who see this and ask “why?”
The short answer is that, as Hackaday believes, “why” is the wrong question.
A longer answer is that the train is simply BETTER when you can control its speed (remotely over wi-fi), more consistent to operate, especially at low speeds because of an auto “throttle-boost” that kicks in when the accelerometer senses that the train is going uphill, and more user-friendly with remote monitoring of the battery state.
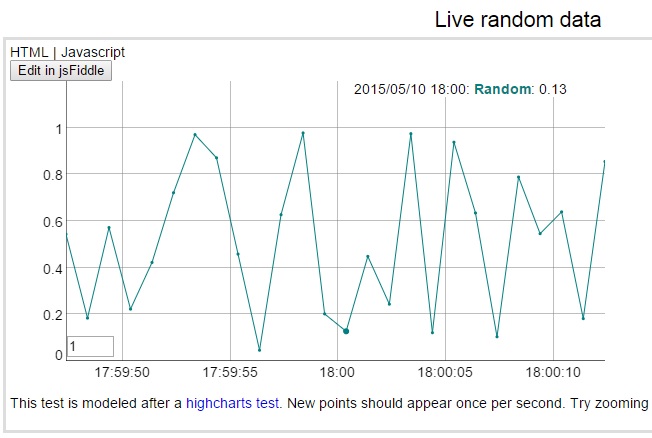
And if you need still more justification, the Train appeared this week at a trade exhibition as a source of IoT data to demonstrate business software (go to YouTube here if you are interested, where one of my colleagues explains).
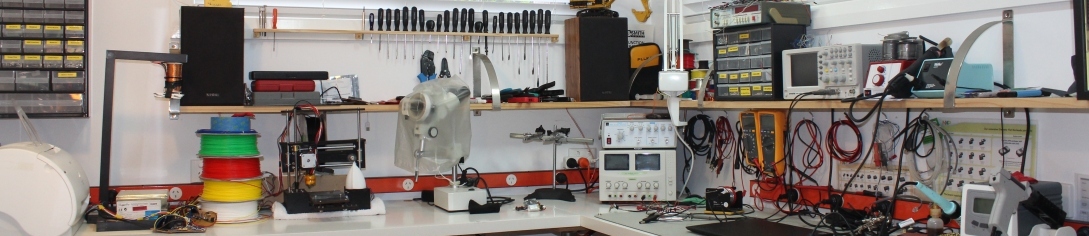
The main challenge was to be able to fit the required electronics into an existing form factor. As it transpired, the toy train was a lot more compact than I had anticipated. I had to undertake some delicate “surgery” to free up space underneath the train and behind the front face, but this was done in a way that a casual observer would not notice.
Follow the link to a full write-up to discover more of the details:
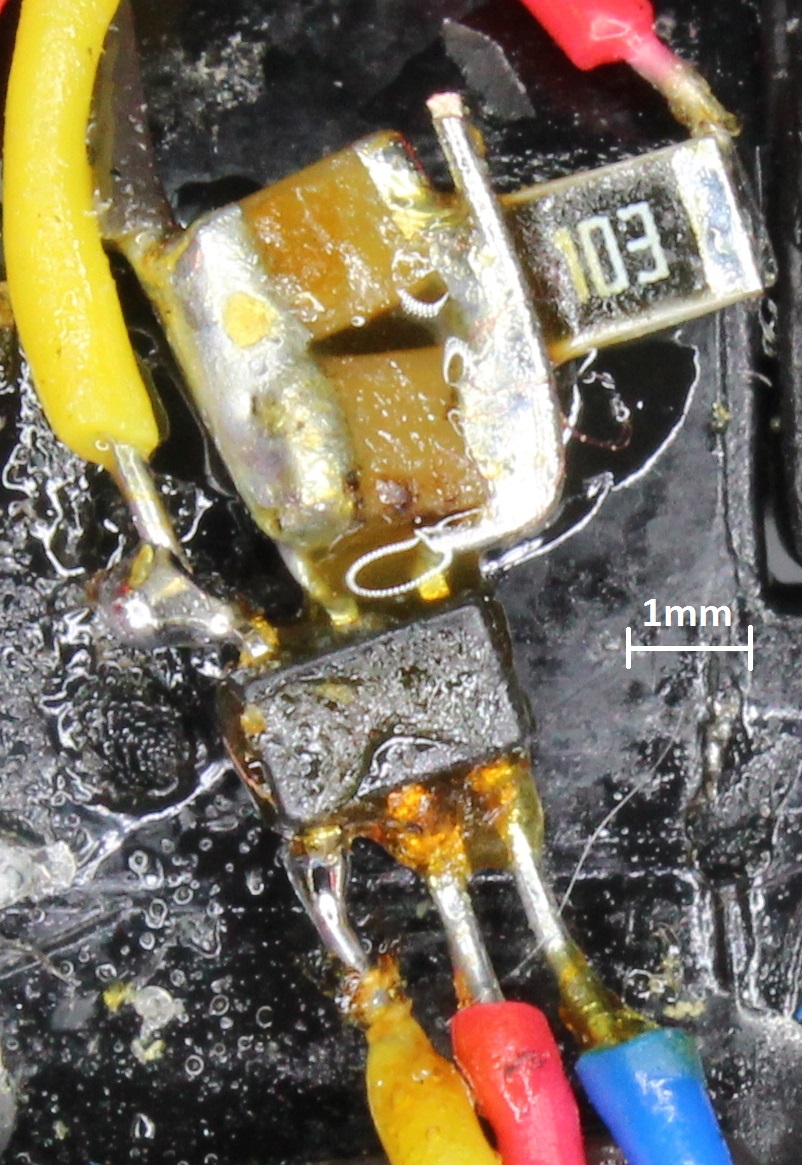
 I therefore came up with a simpler alternative – using an analog switch ic. I was pleased to discover that they are now available in extremely small form factors. Actually, my choice turned out to be rather too small – at a size of 1 mm x 2 mm, soldering directly to each pin (without the benefit of pcb mounting) proved more of a challenge than I was looking for.
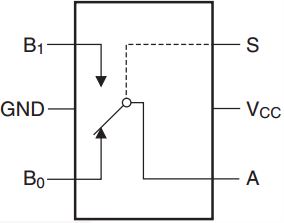 I settled on the